


Ask a preconstruction leader what's due this week and you'll get an answer in seconds.
Ask how many healthcare projects the group has in schematic design right now, broken out by region, and the answer usually starts with "let me have someone pull that together."
The data to answer it already lives in Ediphi: every project, its region, its industry, its design stage. Project Grid View puts all of it on one screen.
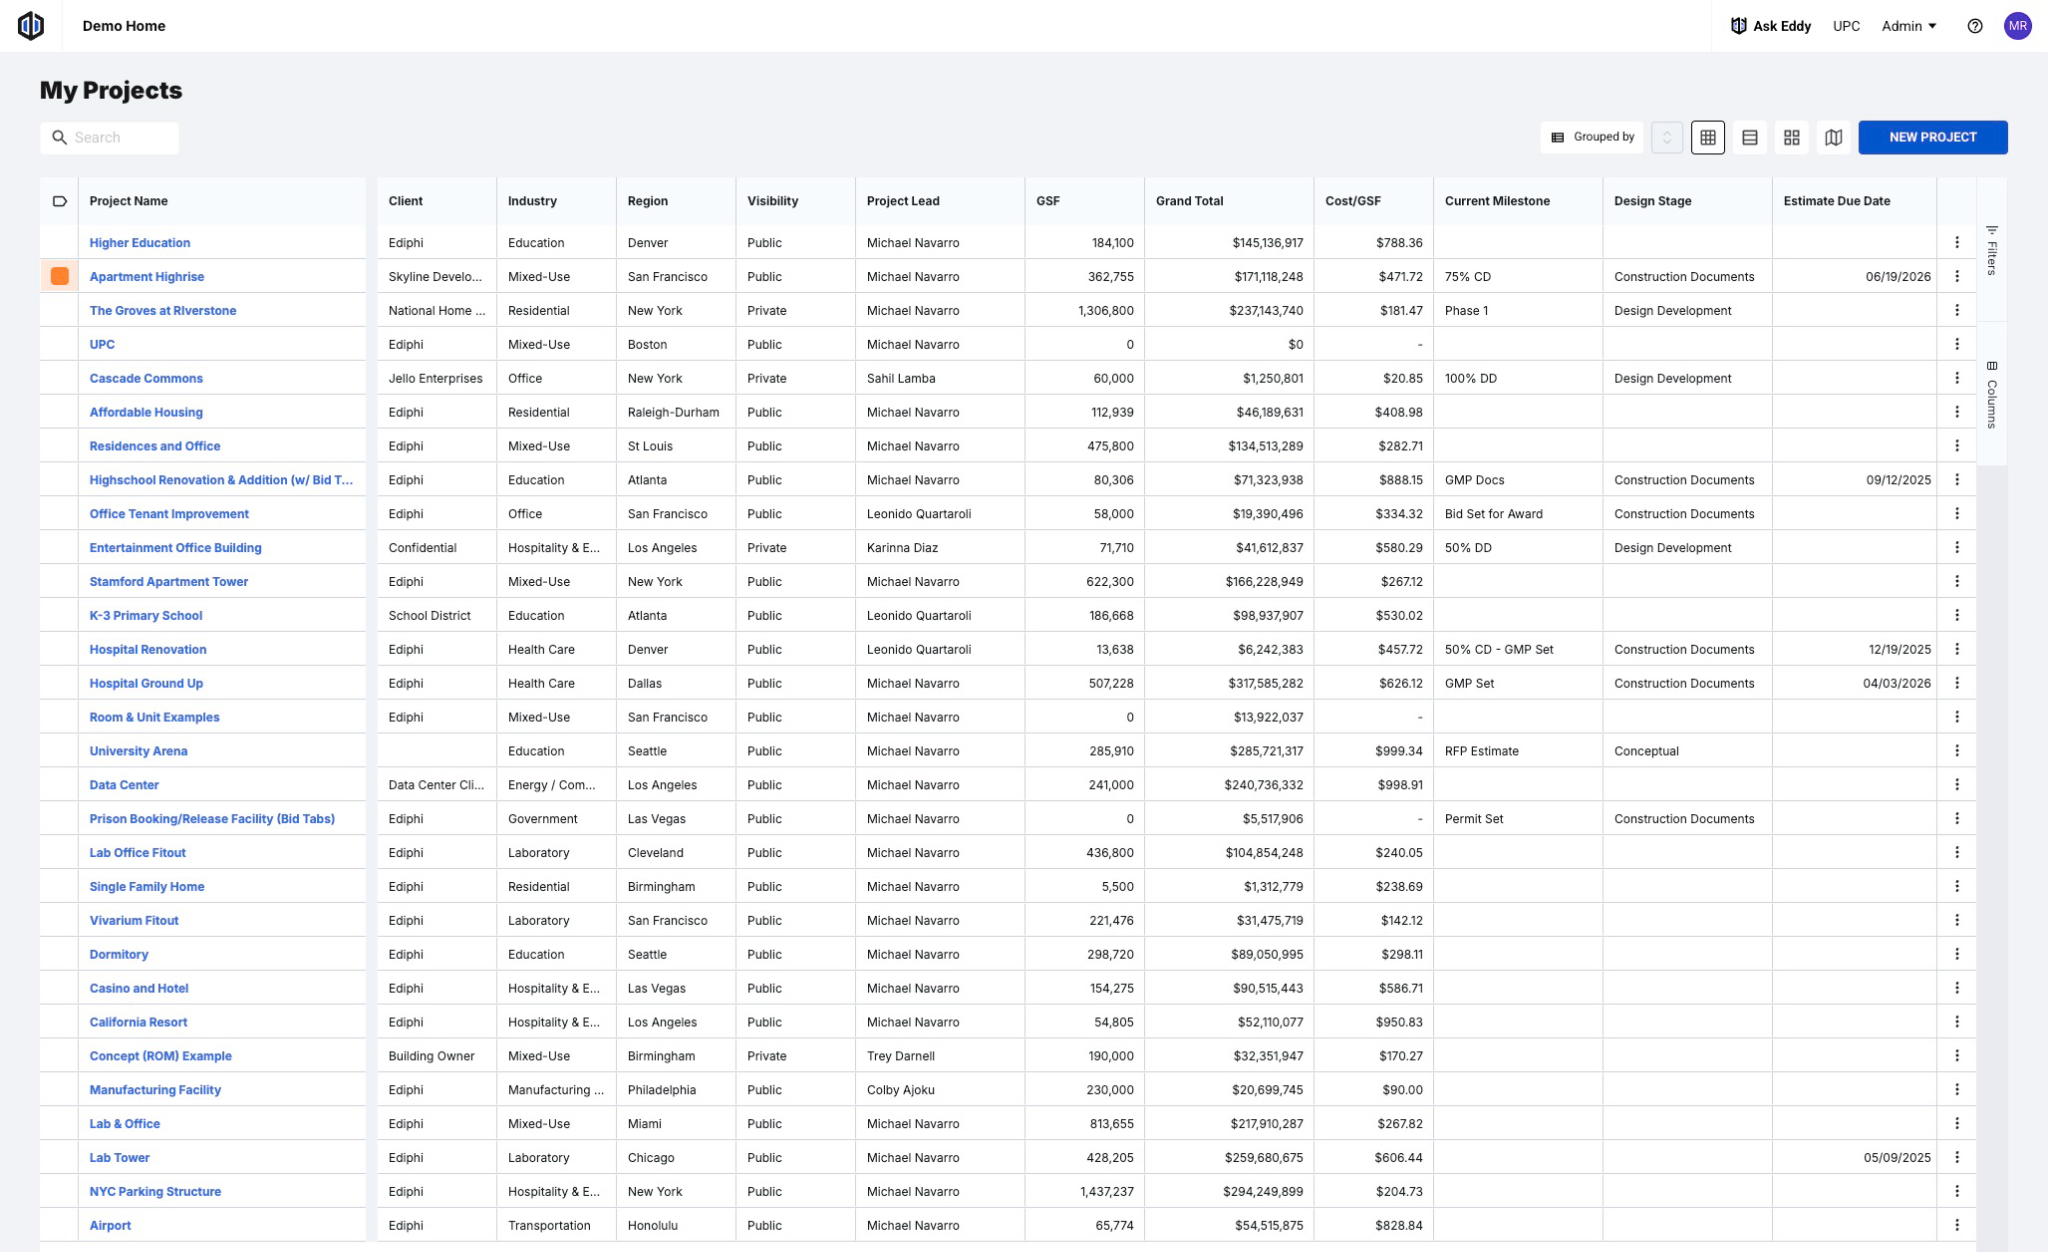
Starting this week, the Projects home screen in Ediphi opens as a grid: one row per project, with columns you can sort, filter, reorder, and group. It's the same project list you already use (worry not — the list, card, and map views you use are still there); but now it’s built to be read at portfolio scale.
[Video Embed]
The portfolio view usually lives in someone's spreadsheet
Preconstruction teams capture plenty of data, but to put it in a format that a leader or an owner can use, is often the hard part.
Research cited by Autodesk found that people in preconstruction roles spend an average of 13.4 hours a week looking for data, more than managers, executives, or BIM/VDC staff.
Ediphi’s own community doubled down on the need for better, more holistic views of ongoing projects. Sarah Forrest, Chief Estimator and Preconstruction Director at Hensel Phelps, says the “10,000 foot view” is critical to how she manages her team:
"One thing that I'm always looking for is ways that I can look at an estimate very quickly and figure out if it's moving in the right direction."
Leaders want to know how current projects break down in a variety of ways: by market, region, or design stage. But estimating software is built for the estimate in front of you, not the portfolio behind it.
Sarah’s standard for solutions is just as short: "The more simple that we can make things, the bigger impact."
Project Grid View takes that same instinct up one level, from a single estimate to every project the group is carrying.
What's in Project Grid View
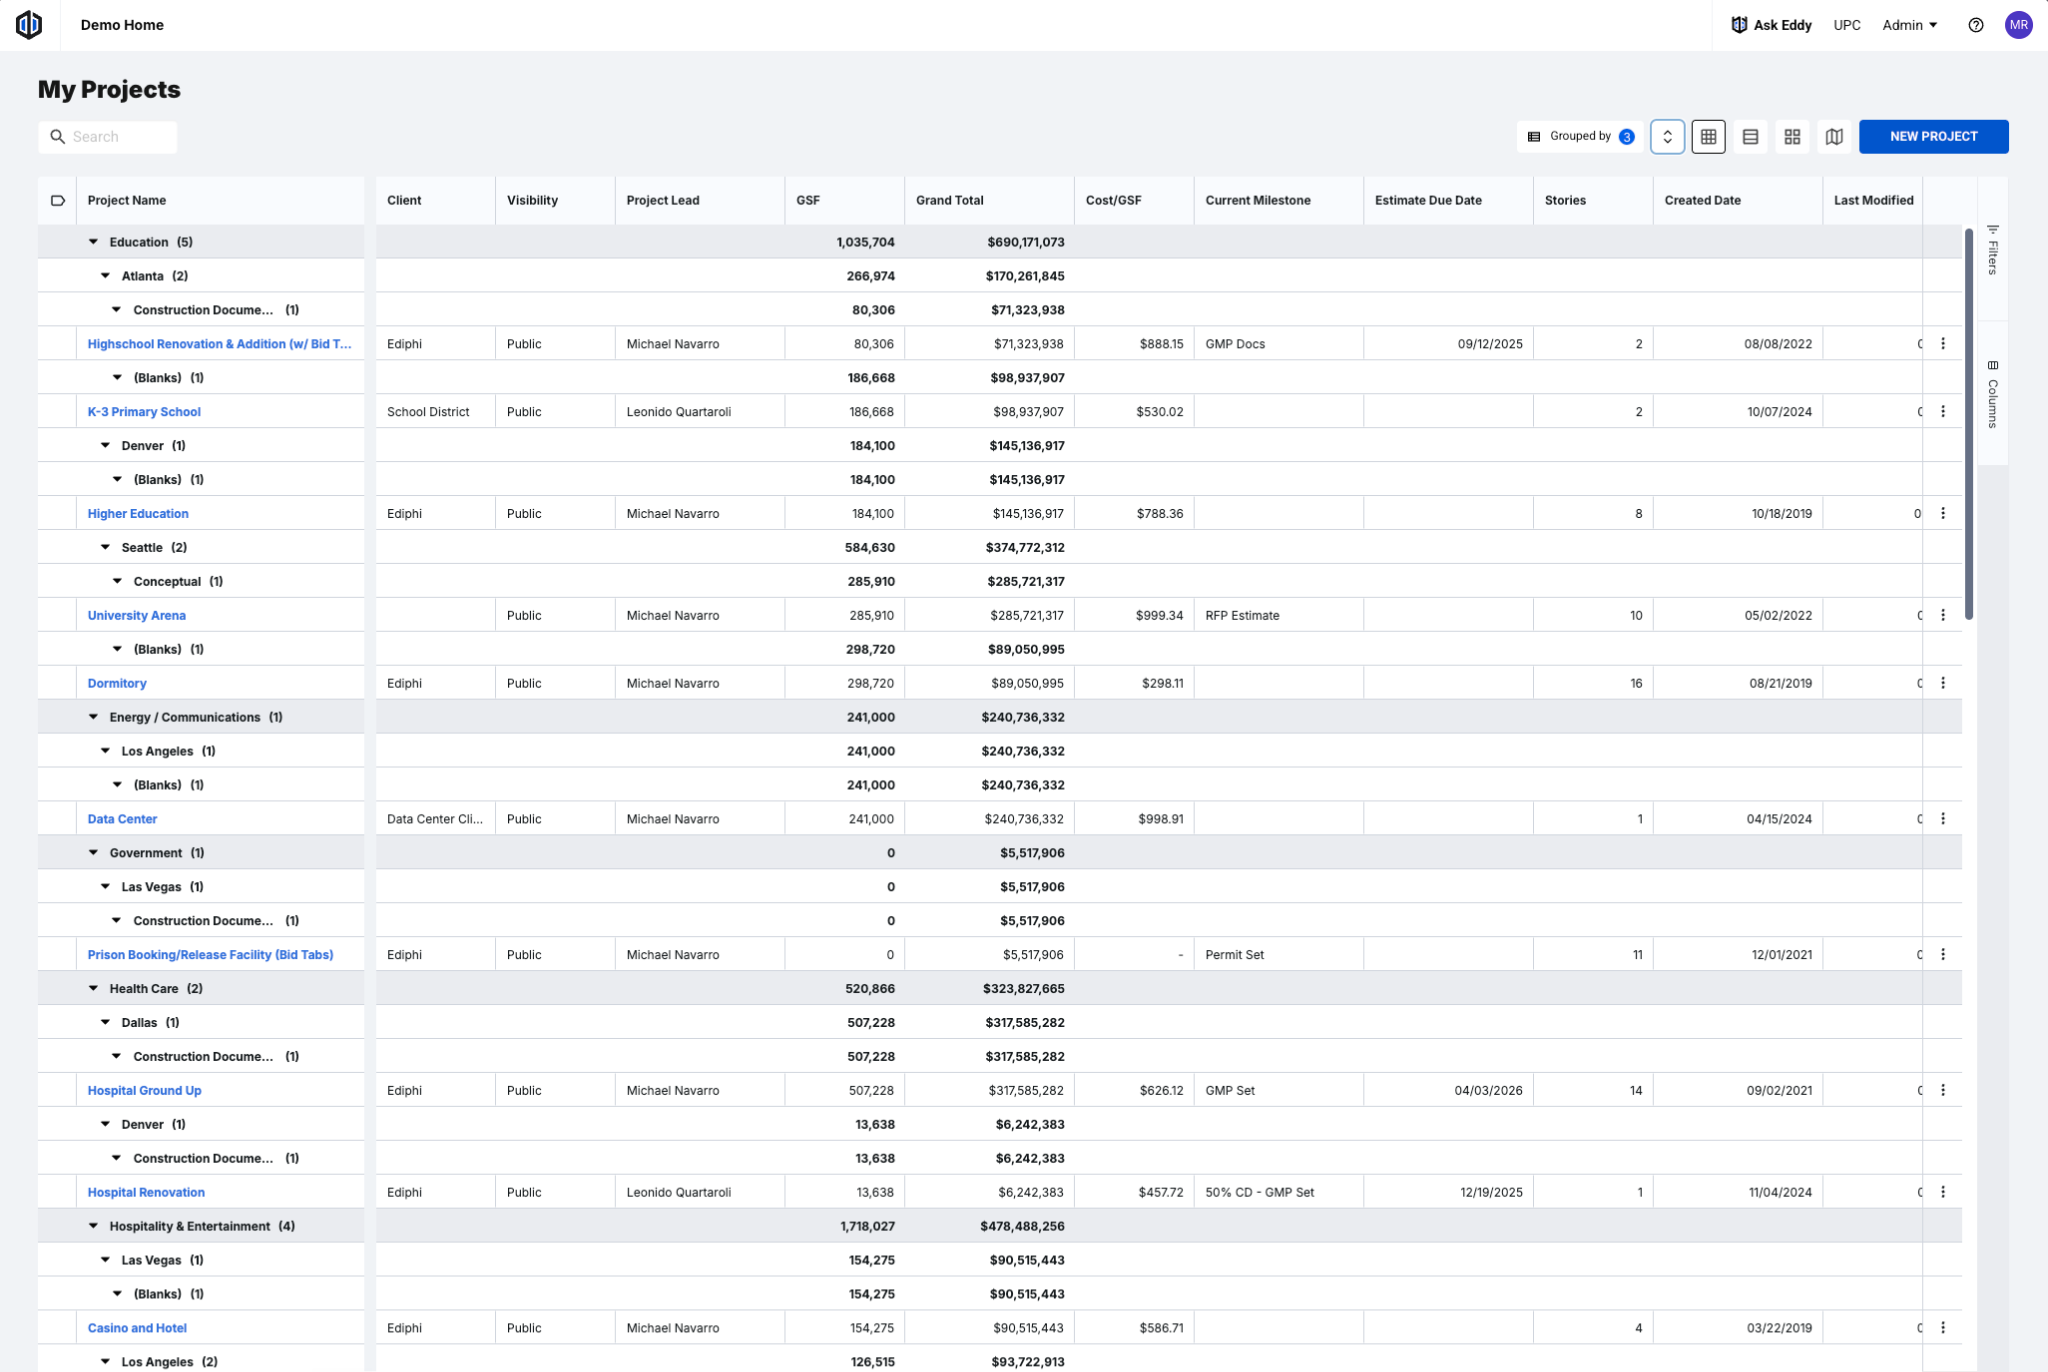
Project Grid View presents ongoing projects as an open table: one row per project, one column per piece of project information.
This grid was designed to stay fast and readable for companies carrying hundreds of projects and uses the project data your team already enters in Ediphi, so there's nothing to set up or import.
Choose, sort, and filter your columns
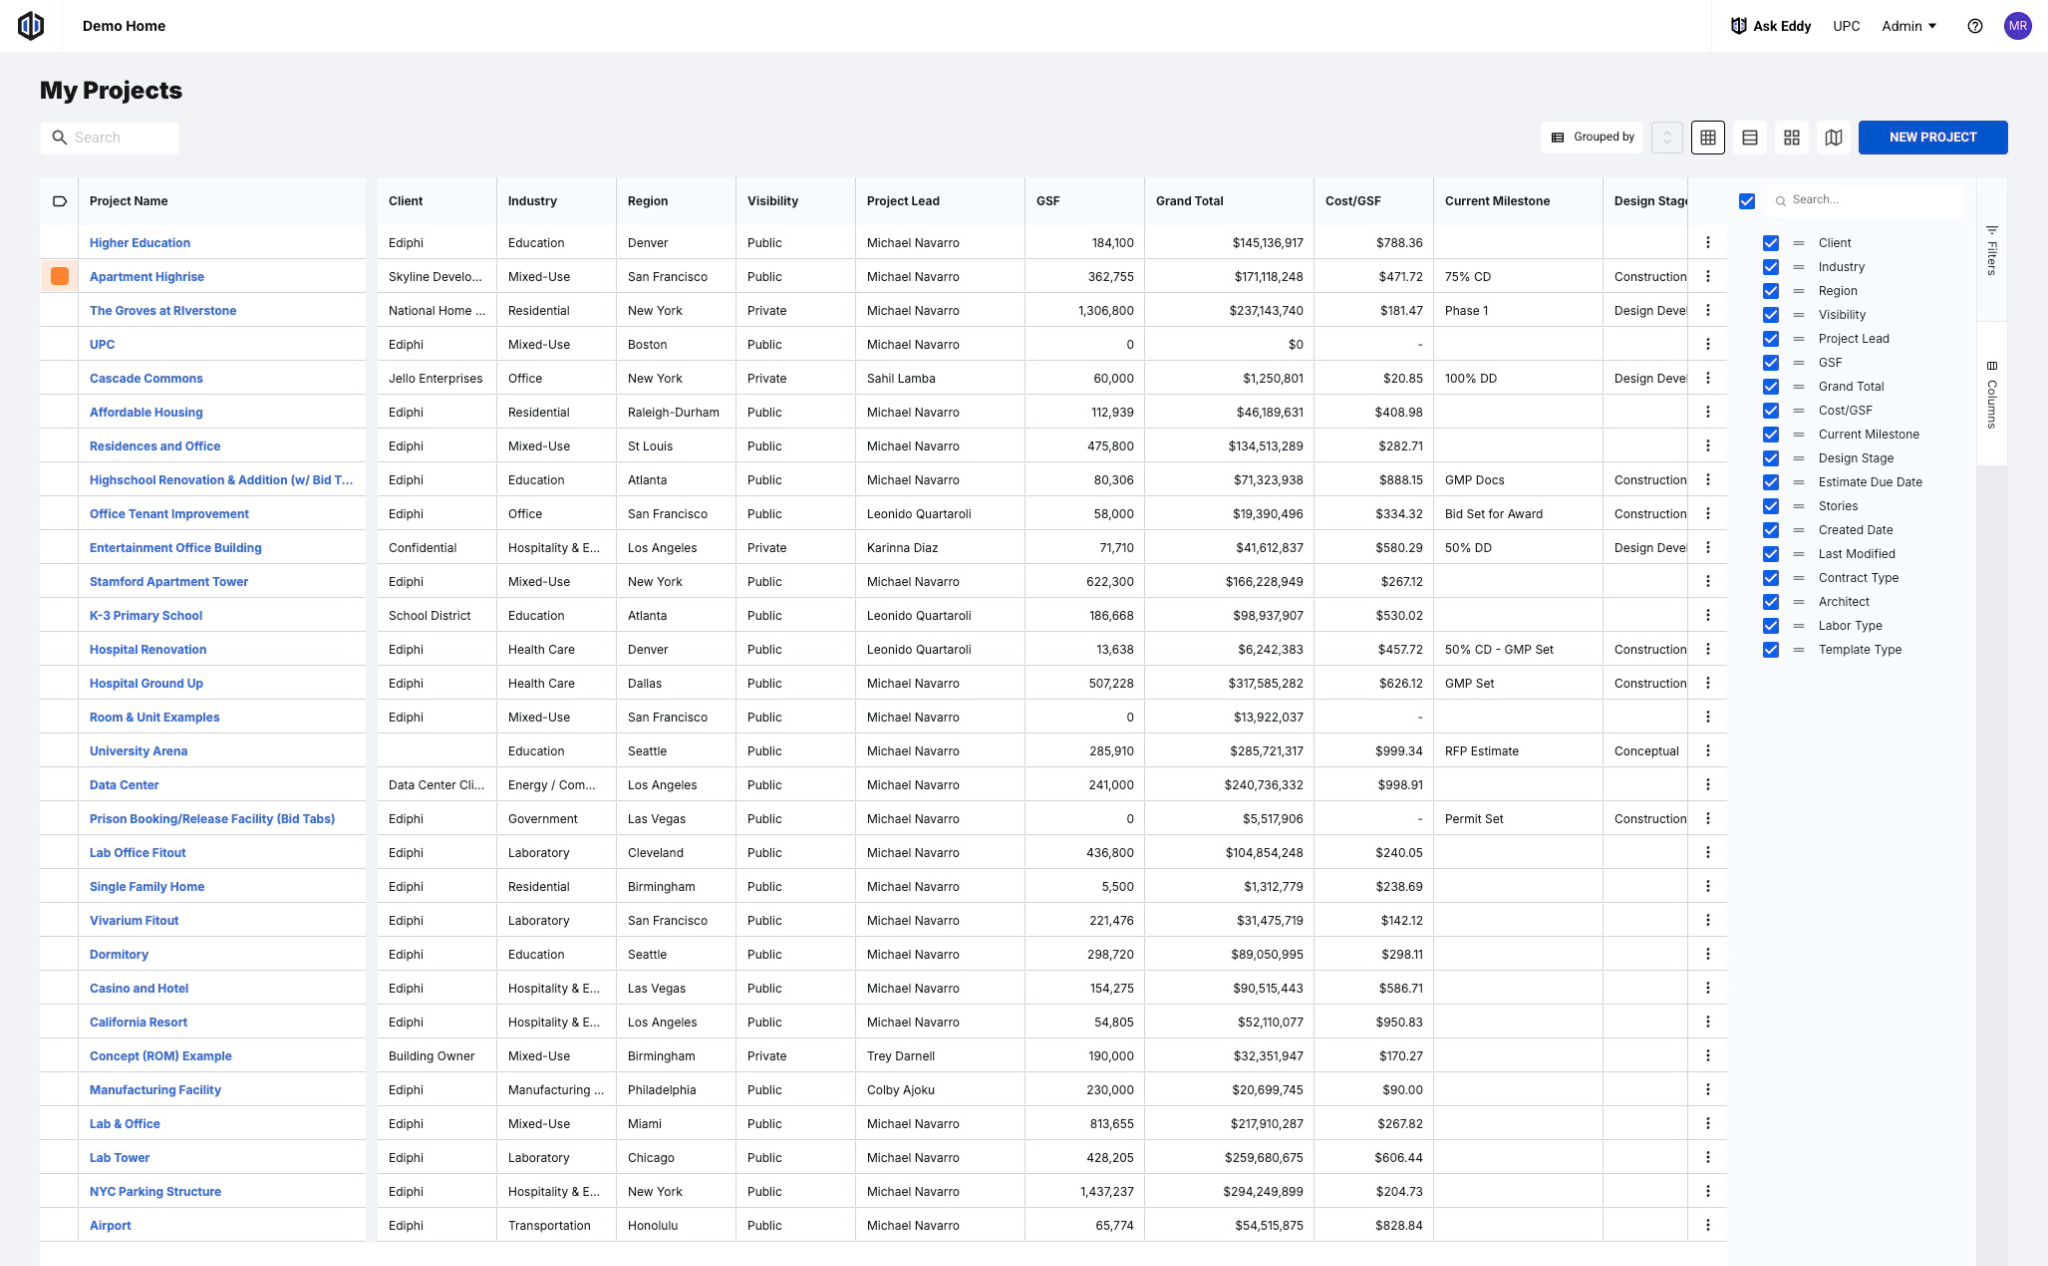
Show or hide columns, including project metadata like region, industry, and design stage. Drag columns into the order that makes sense for how you read your projects.
Group by what matters to you
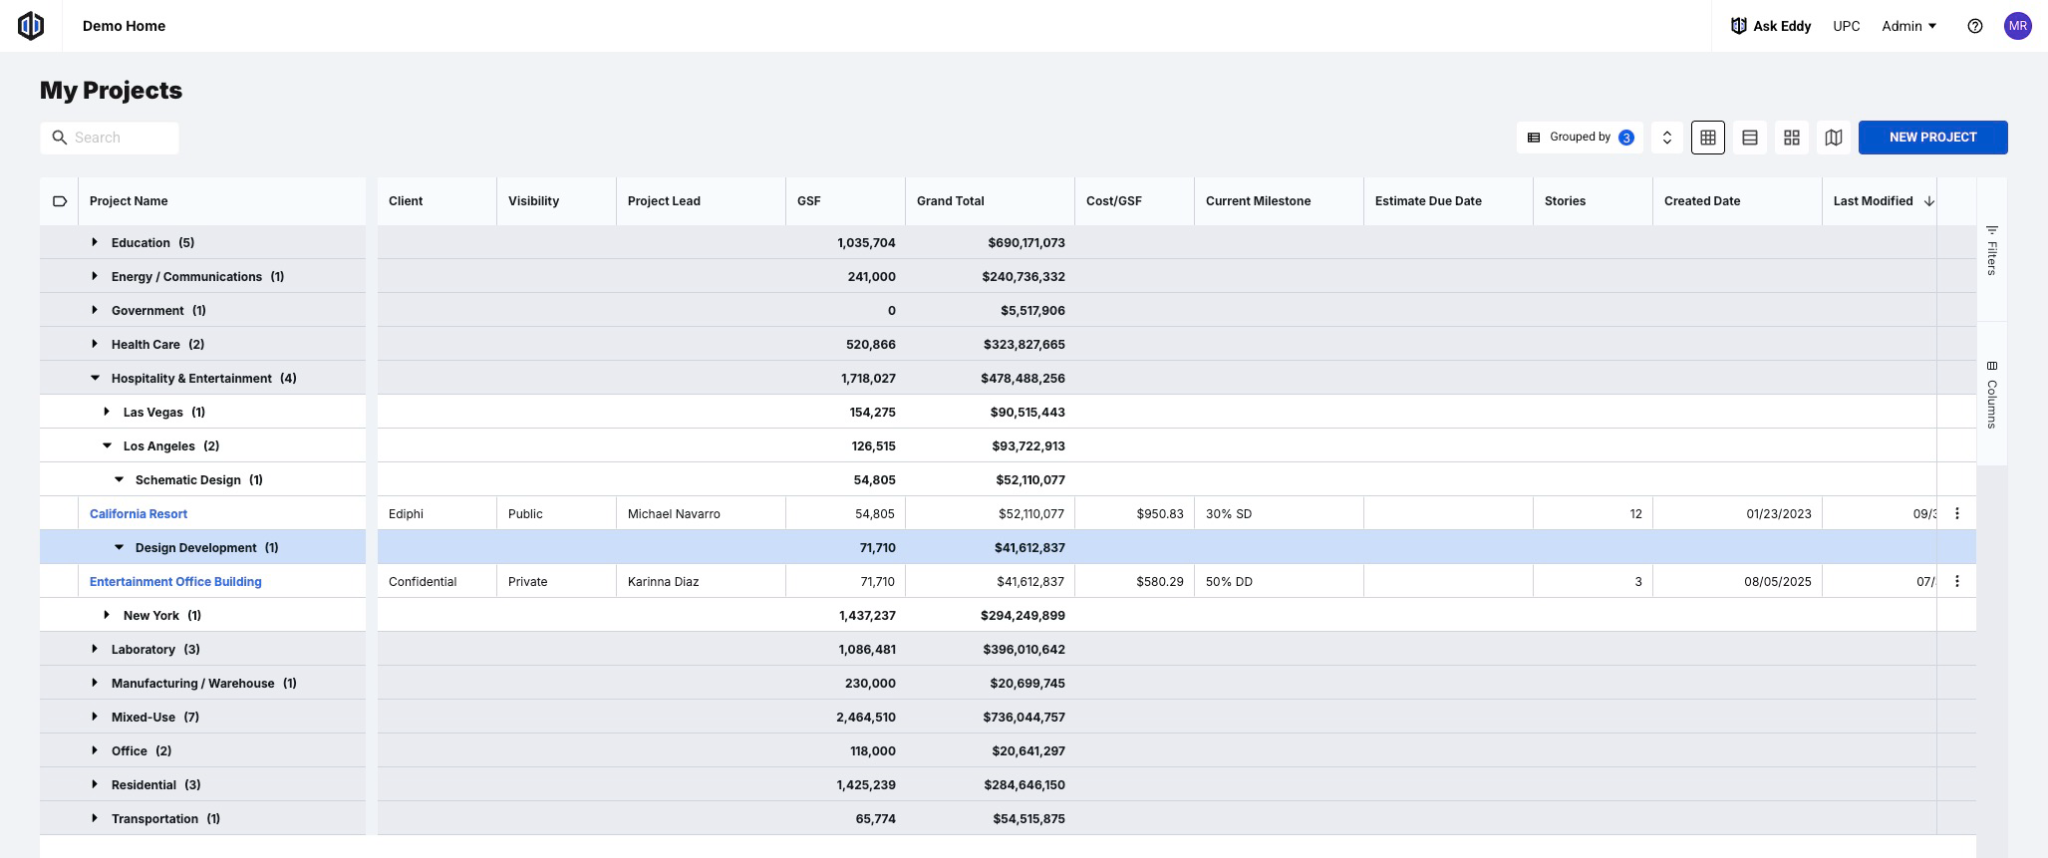
Group projects by any combination of fields, for example industry, then region, then design stage. Each group shows a summary, so you can see how the portfolio breaks down before opening a single project.
Your view stays your view
Your view choices are saved to you as an individual user. Refresh the page or come back tomorrow, and the grid looks the way you left it. Changes you make don't affect anyone else's view.
Now available in Ediphi
Project Grid View is live in the product now. The next time you open Projects, a short in-app video will walk you through it.
This release is the first step toward portfolio-level reporting in Ediphi and future dashboards will build on the same grid.
Watch the 60 second walkthrough.

.svg)





.svg)
.svg)